Fishing Cat Data Dive
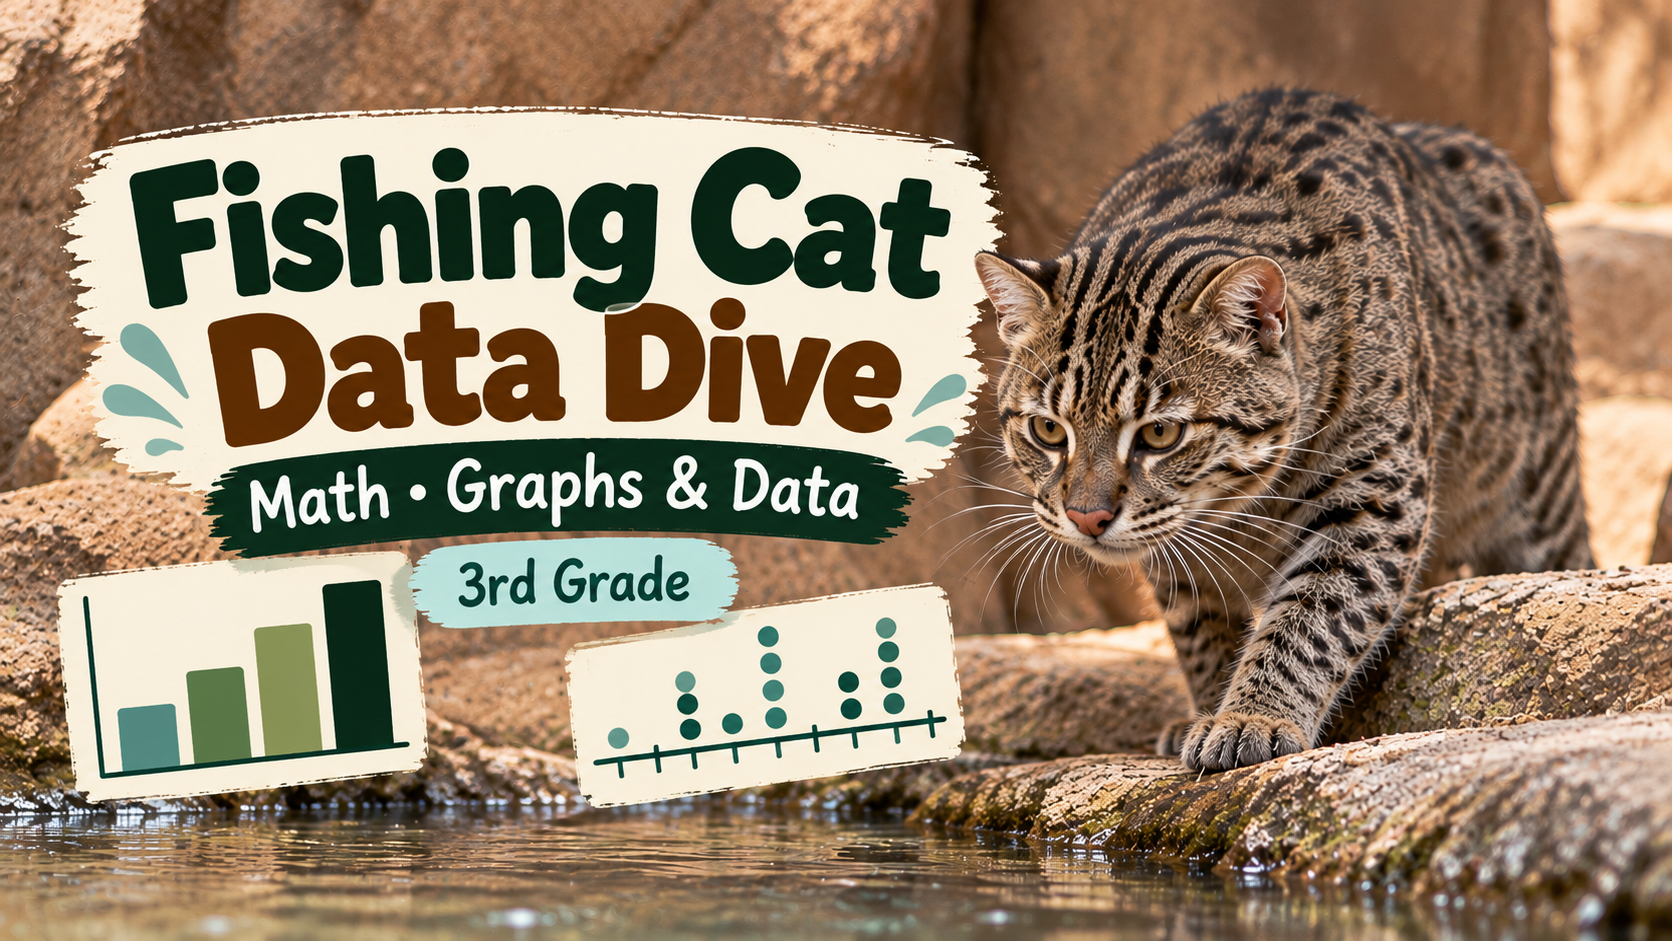
In this hands-on, zoo-themed math lesson, students will analyze and interpret four distinct data representations—a dot plot, a data table, a scaled picture graph, and a bar graph—focusing on the swimming habits and fish consumption of Riverbanks Zoo’s fishing cats. Through individual practice and collaborative discussion, students will solve one- and two-step word problems involving scaled data to draw meaningful real-world conclusions.
Essential Question
How do different visual data displays help us organize, compare, and understand real-world information about animals?
Grade(s):
- 3
Subject(s):
Recommended Technology:
Smart Board or projector to clearly display the data displays and use them during the direct instruction portion of the lesson.
Other Instructional Materials or Notes:
Enlarge & display each of the following data displays (all located in the resources tab on the student performance task).
Display 1 (Dot Plot): Fishing Cat Weights (lbs) — Paw print dot plot with key.
Display 2 (Data Table): Morning Swimming Log — Feet swam per day of the week (Monday through Friday).
Display 3 (Scaled Picture Graph): Morning Fish Eaten — Scaled graph with key.
Display 4 (Bar Graph): Fish Caught by Location — Bar graph depicting habitat locations.
Student Response Worksheets & Answer Keys.
Lesson Progression
1. Hook & Introduction (10 Minutes)
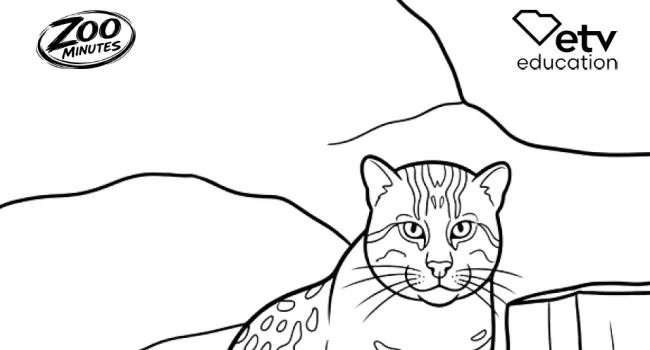
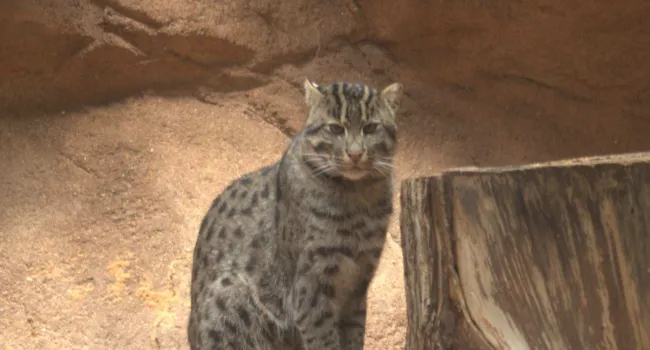
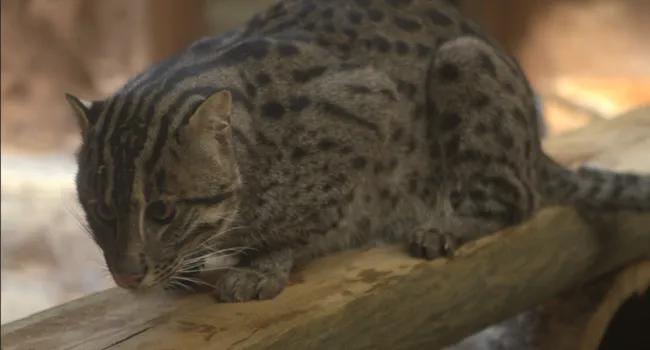
Engage: Show the Fishing Cat video (linked in the resources tab)about fishing cats. Explain to students that zookeepers at Riverbanks Zoo in South Carolina keep careful track of the fishing cats’ weight, swimming habits, and feeding habits to make sure they stay healthy.
Connect: Show the four different data displays side-by-side. Point out that while they all show information about the fishing cats, each display presents the data in a unique visual way (dots, tables, pictures with scales, and bars).
Introduce Essential Question: Read the EQ aloud and set the goal: Today we are going to become Data Explorers to answer questions about our zoo animals!
2. Guided Modeling & Whole-Group Exploration (15 Minutes)
Direct Instruction: Model how to approach each display type:
Dot Plot: Focus on reading tick marks along the number line and counting vertical units.
Data Table: Walk through reading rows and columns to match a day/category to a value.
Scaled Picture Graph: Emphasize checking the Key first and skip-counting by the value of that key.
Bar Graph: Demonstrate tracking the top of a bar across to the vertical axis to find the total value.
Guided Practice: Ask quick, verbal check-for-understanding questions:
"If one symbol equals 2 fish, how many fish do 4 symbols represent?"
"Which bar is the tallest on our location graph, and what does that tell us?"
3. Independent / Station Practice (20 Minutes)
Distribute the student performance tasks accompanying each data display.
Students work independently or in pairs to analyze the graphs and answer one-step and multi-step problem sets (e.g., finding totals, comparing differences between categories, and evaluating zoo goal scenarios).
4. Lesson Closure & Reflection (10 Minutes)
Bring the class back together to discuss answer strategies for multi-step questions (e.g., combining two categories before comparing to a third).
Exit Ticket Question: "Why is it important to check the KEY on a picture graph before you start counting the pictures?"
Teacher Notes
Differentiation: Manipulatives: Allow students to use counters or base-ten blocks to model multi-step addition and subtraction problems. Visual Key Prompts: Provide a physical or highlighted reminder card near scaled graphs showing skip-counting sequences (e.g., 2, 4, 6, 8, 10).
Extension: Data Representation Transfer: Provide a raw set of numbers and challenge students to convert a data table into a corresponding bar graph or dot plot independently.
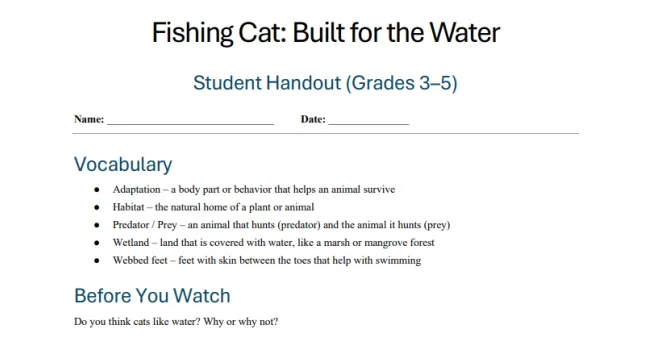
Fishing Cat: Built for the Water (Grades 3-5) Handout
This handout goes along with the "Fishing Cat: Built for the Water (Grades K-5)" lesson.
View AssetAssessments
Use the student performance task linked in the resources tab to assess student learning outcomes.