Ice Cream Data Sets
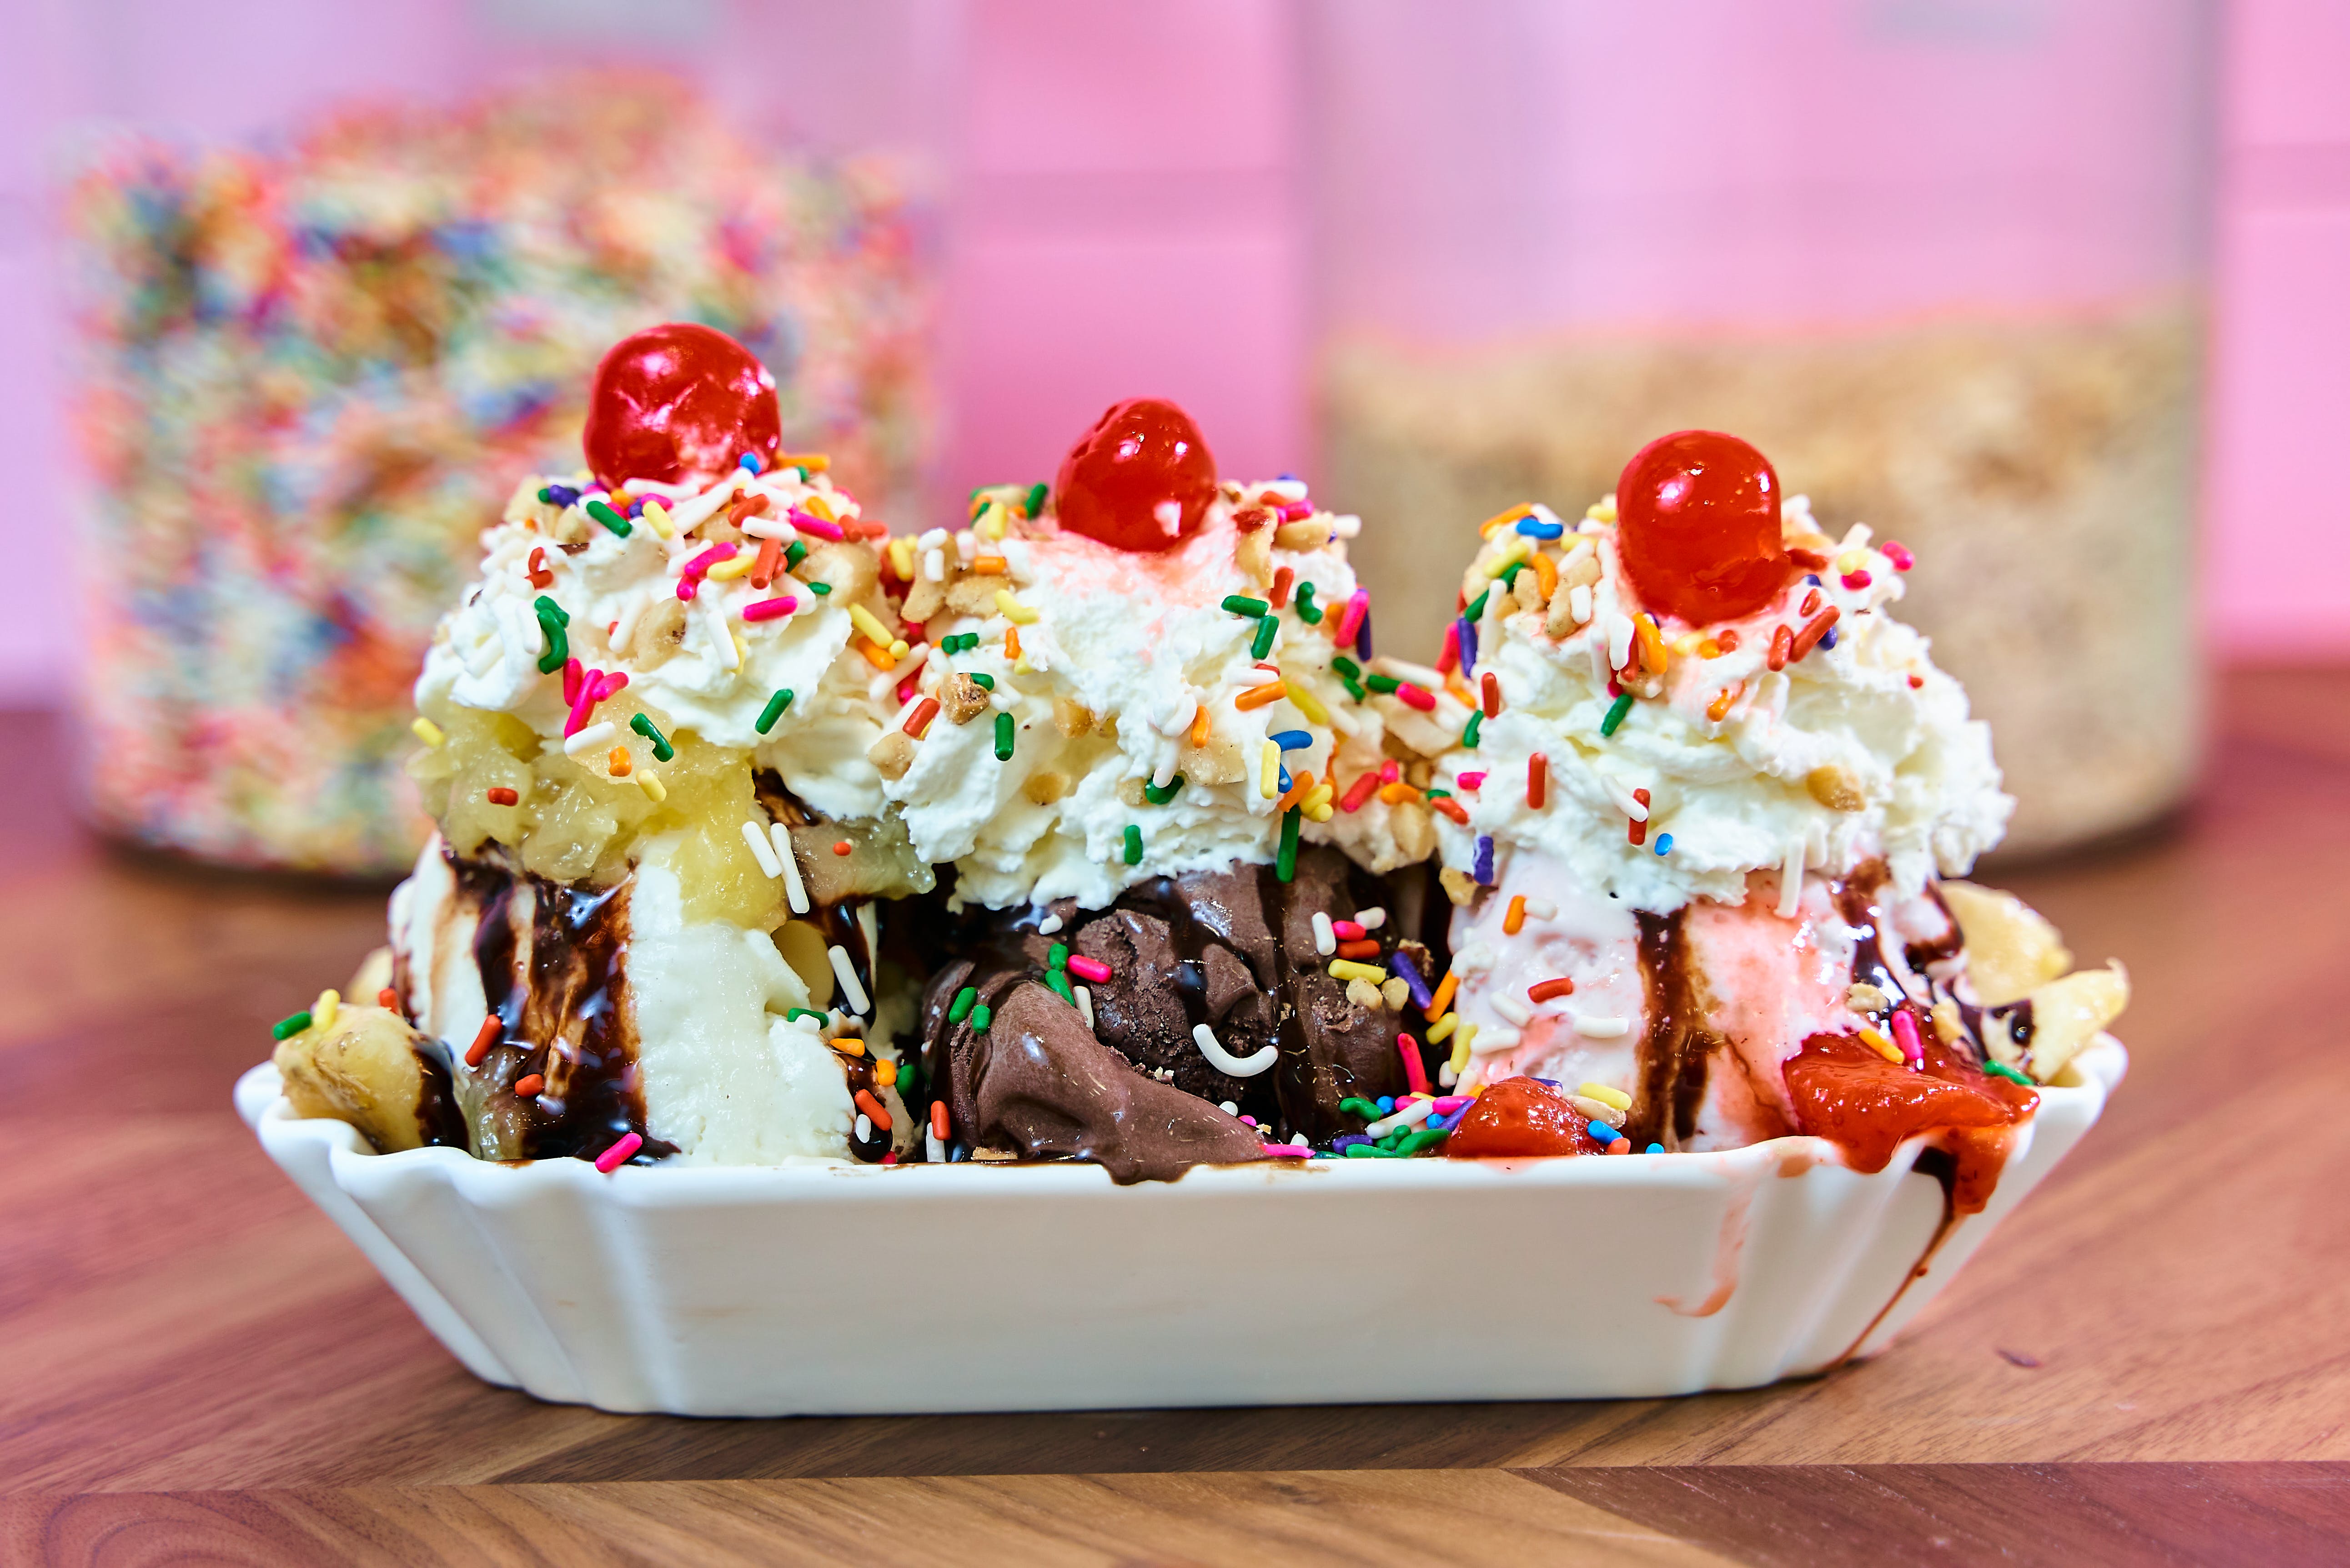
The students will be able to collect, organize, and represent data in numerous ways. They will use manipulatives to help make tallies. They will also use information they have collected to create picture and bar graphs.
Lesson Partners: PBS LearningMedia
Essential Question
How can we represent a data set?
Why is is important for us to be able to represent data that we collect?
Grade(s):
- 1
- 2
Subject(s):
Recommended Technology:
-Laptop
-Smart Board
Other Instructional Materials or Notes:
-White boards
-Dry erase markers
-Colored manipulatives
-Pencil
-Paper
-Worksheet
Lesson Progression
- Teacher will explain that today’s lesson is on collecting, organizing, and representing data.
- Teacher will play Curious George: Graphing video to get students thinking about sorting and graphing.
- Teacher will give each student a white board and dry erase marker. As the teacher asks "Would you rather have chocolate, strawberry, or vanilla ice cream?", the students will write their answers.
- The teacher models and creates a picture graph for the ice cream survey.
- The teacher will ask up to three different questions and make tallies on the board for each question. Other examples of questions: (limit to 3 options for now) Do you prefer the color yellow, blue, or green? Do you prefer pizza, tacos, or macaroni and cheese?
- The teacher will go over the results of each question, and then represent using a picture graph, with the help of the class.
- After the teacher has created the picture graph of the student’s responses on one of the questions, the teacher will split the students into groups and provide manipulatives such as colored blocks or bears. The students should sort the items given to them by color, and create a tally chart like the ones we did as a class.
- The teacher should allow 15 minutes for the students to work in their groups and observe the students working.
- After the students have had time to work in their groups, the teacher will hand out a worksheet for the students to complete for more practice.
- Teacher will pass out worksheets. Allow students 10-15 minutes to complete worksheet.
- Teacher will review the worksheet with class, and answer any questions the students may have.
- Teacher will guide students through creating a bar graph of the results on the worksheet.
Teacher Notes
Differentiate: Begin with creating a table that shows the question and the options. Once table set up is successful, begin marking tallies using provided data. Students may struggle with table set up, making tally packs, or number count associations. Provide remediation as necessary with multiple opportunities to show success.
Extend: Offer questions with more than 3 options. Offer questions with larger numbers of data points (respondents).
Tally Up the Objects
View ResourceGraphing Video
View ResourceStandards
- 2.DPSR Data, Probability, and Statistical Reasoning
- 1.DPSR Data, Probability, and Statistical Reasoning
Assessments
The teacher will assess the students by observing the group activity, and how well they are able to complete the worksheet given. If the students are struggling to participate in the activity, and on the worksheet, the teacher will know that these students need more work.